Why map Microsoft's network?
To brief DBBA Capital on Microsoft (MSFT), this article traces how the stock sits inside a global investor–stock network. The study spans quarterly holdings (2016–2023) and monthly returns (2018–2024), looking for structures that could justify confidence in, or hedging against, MSFT. Theproject’s emphasis is on investor behaviour, network topology, and the unusual conditions created by COVID-19.
Building the bipartite investor–stock graph
The raw data lists institutional investors and their quarterly positions. I modelled that as a bipartite network with investors on one side and stocks on the other and used edge weights to track how many quarters an investor held a position, then coloured each community via the Louvain modularity heuristic.1
Preprocessing pipeline
- Abbreviated investor names and dropped missing records to normalise identifiers.
- Constructed an investor-by-stock matrix so each entry counts quarters invested.
- Generated a weighted bipartite
networkxgraph from the matrix for downstream analysis.
partitions = nx.algorithms.community.louvain_communities(
    B,
    weight="weight",
    resolution=20,
    threshold=1e-07,
    max_level=None,
    seed=6772,
)

The layout makes two immediate points. First, most investors concentrate on a narrow slice of the market, reinforcing the concept of a high-conviction “safe” stock set. Second, MSFT already appears central because high-weight edges radiate from its community.
Ego networks: investors vs. stocks
An MSFT-centred ego network on the bipartite graph (EGO1) retains investor identities, so each edge encodes the number of quarters an investor held MSFT.2 Roughly 43% of investors held MSFT at least once, but the holding lengths vary widely (mean 6.17 quarters, standard deviation 8.78), highlighting divergent risk tolerances.

Projecting the network onto the stock side (EGO2) replaces investors with stocks that share investors. MSFT suddenly has hundreds of neighbours, yet most edges have weight one, meaning those stocks only share a single investor.

| Graph | Nodes | Edges | Edge weight meaning |
|---|---|---|---|
| EGO1 (bipartite) | MSFT + investors | Investor → MSFT | Quarters held |
| Stock projection | Stocks (global universe) | Stock ↔ stock | Shared investors (count) |
| EGO2 | MSFT + neighbouring stocks | Stock ↔ stock | Shared investors (count) |
The comparison shows why EGO1 is better for reading the depth of conviction by investor, while EGO2 reveals the breadth of association across correlated stocks.
Filtering the projection
The full stock projection contains 1,529 stocks and 108,956 edges. To make the structure interpretable I applied thresholding on degree (> 400) and shared-investor weight (> 5). That removes weak ties and exposes a dense core of technology and finance names tightly connected to MSFT.
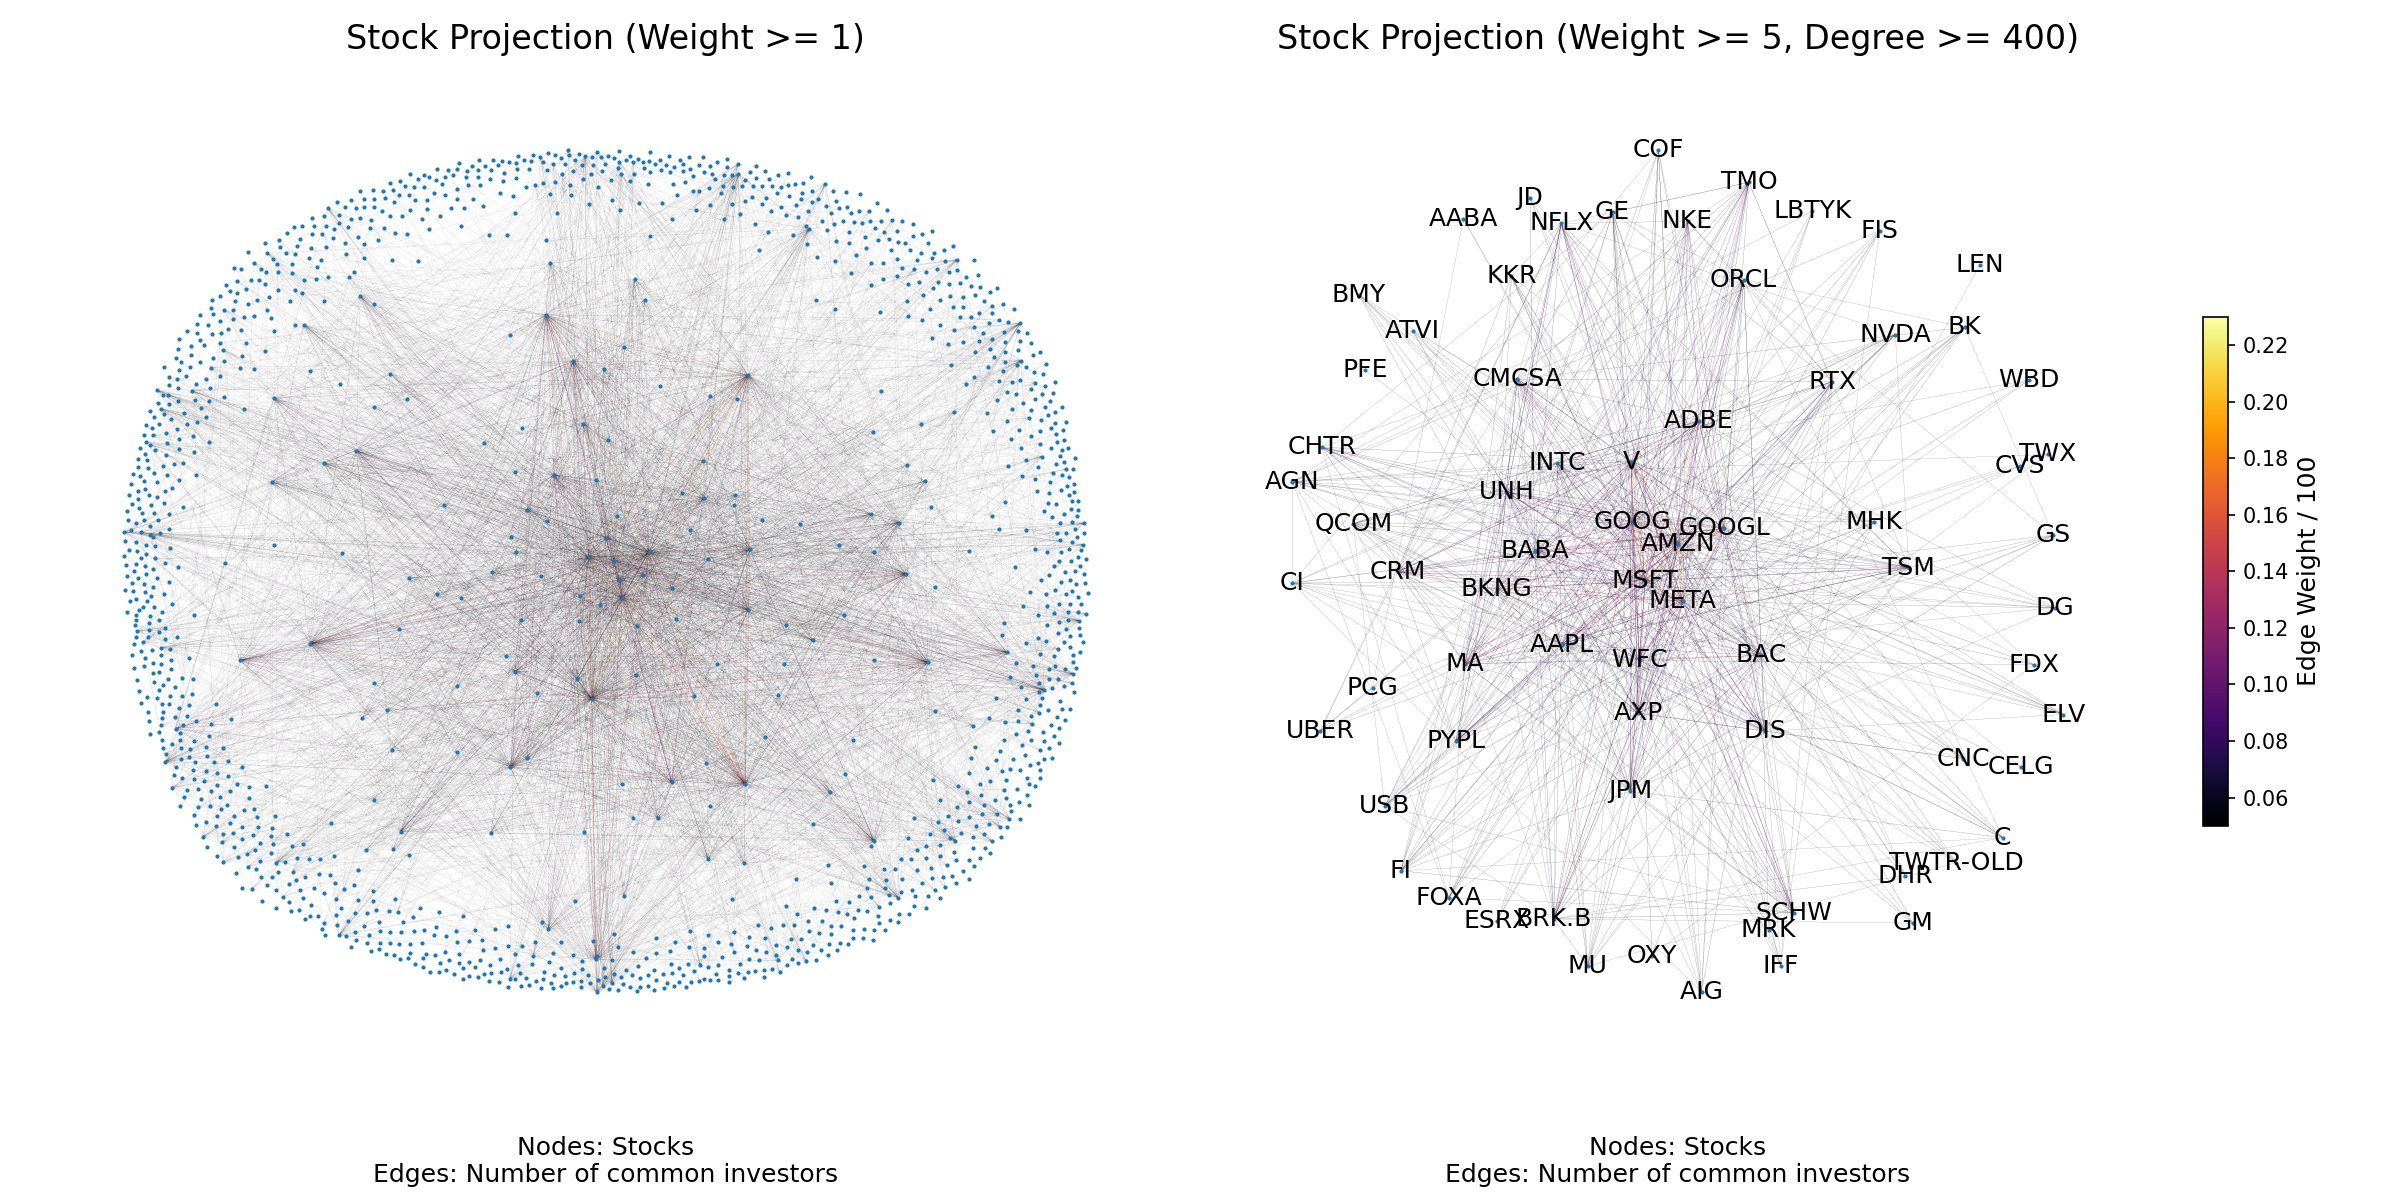
The filtered graph suggests DBBA Capital can treat MSFT as a proxy for a larger tech-finance block: META, GOOGL, AMZN, JPM, and UNH all sit in the immediate neighbourhood and share investor flows.
Pandemic-era dynamics
Quarter-by-quarter statistics reveal how COVID-19 distorted the MSFT subnetwork.3 While raw node and edge counts stay flat, density, clustering, and average degree fall for MSFT’s ego projection during 2020, reflecting investors consolidating into perceived “safe” stocks. Yet those same metrics remain higher than the market-wide baseline, so MSFT never loses its central footing.

| Quantity | Informative? | Takeaway for MSFT |
|---|---|---|
| Density | ✓ | Drops during COVID-19 as portfolios narrow, but remains above IQP. |
| Clustering coefficient | ✓ | Divergent trend confirms a tech/finance clique around MSFT. |
| Degree / Strength | ✓ | Strong positive trend and sharp correction confined to MSFT ego. |
| Assortativity | ✗ | No decisive change for MSFT. |
The post-pandemic reversion across density, degree, and strength supports the hypothesis that 2020 behaviour was an anomaly rather than a lasting regime shift.
Centrality in a non-transitive world
Because edges encode “shared investors”, relationships are non-transitive: if A and B share an investor and B and C share an investor, nothing guarantees A and C are related. That undermines path-based centrality metrics.4
| Centrality | Why it struggles here |
|---|---|
| Closeness | Shortest paths do not correspond to meaningful influence. |
| Betweenness | Overstates importance of nodes sitting on accidental paths. |
| Degree | Captures popularity but ignores neighbour quality. |
| Eigenvector | ✓ Relies on direct neighbours and inherits their influence. |
Eigenvector centrality therefore became the primary measure of “influence” in the stock network.

Minimum spanning tree and COVID-19
To study monthly return correlations I built a minimum spanning tree (MST) on the stock network. In normal periods MSFT is the hub of a technology cluster, but during the pandemic it moves to the periphery while crashed sectors (waste management, transportation, defence) take over the backbone.

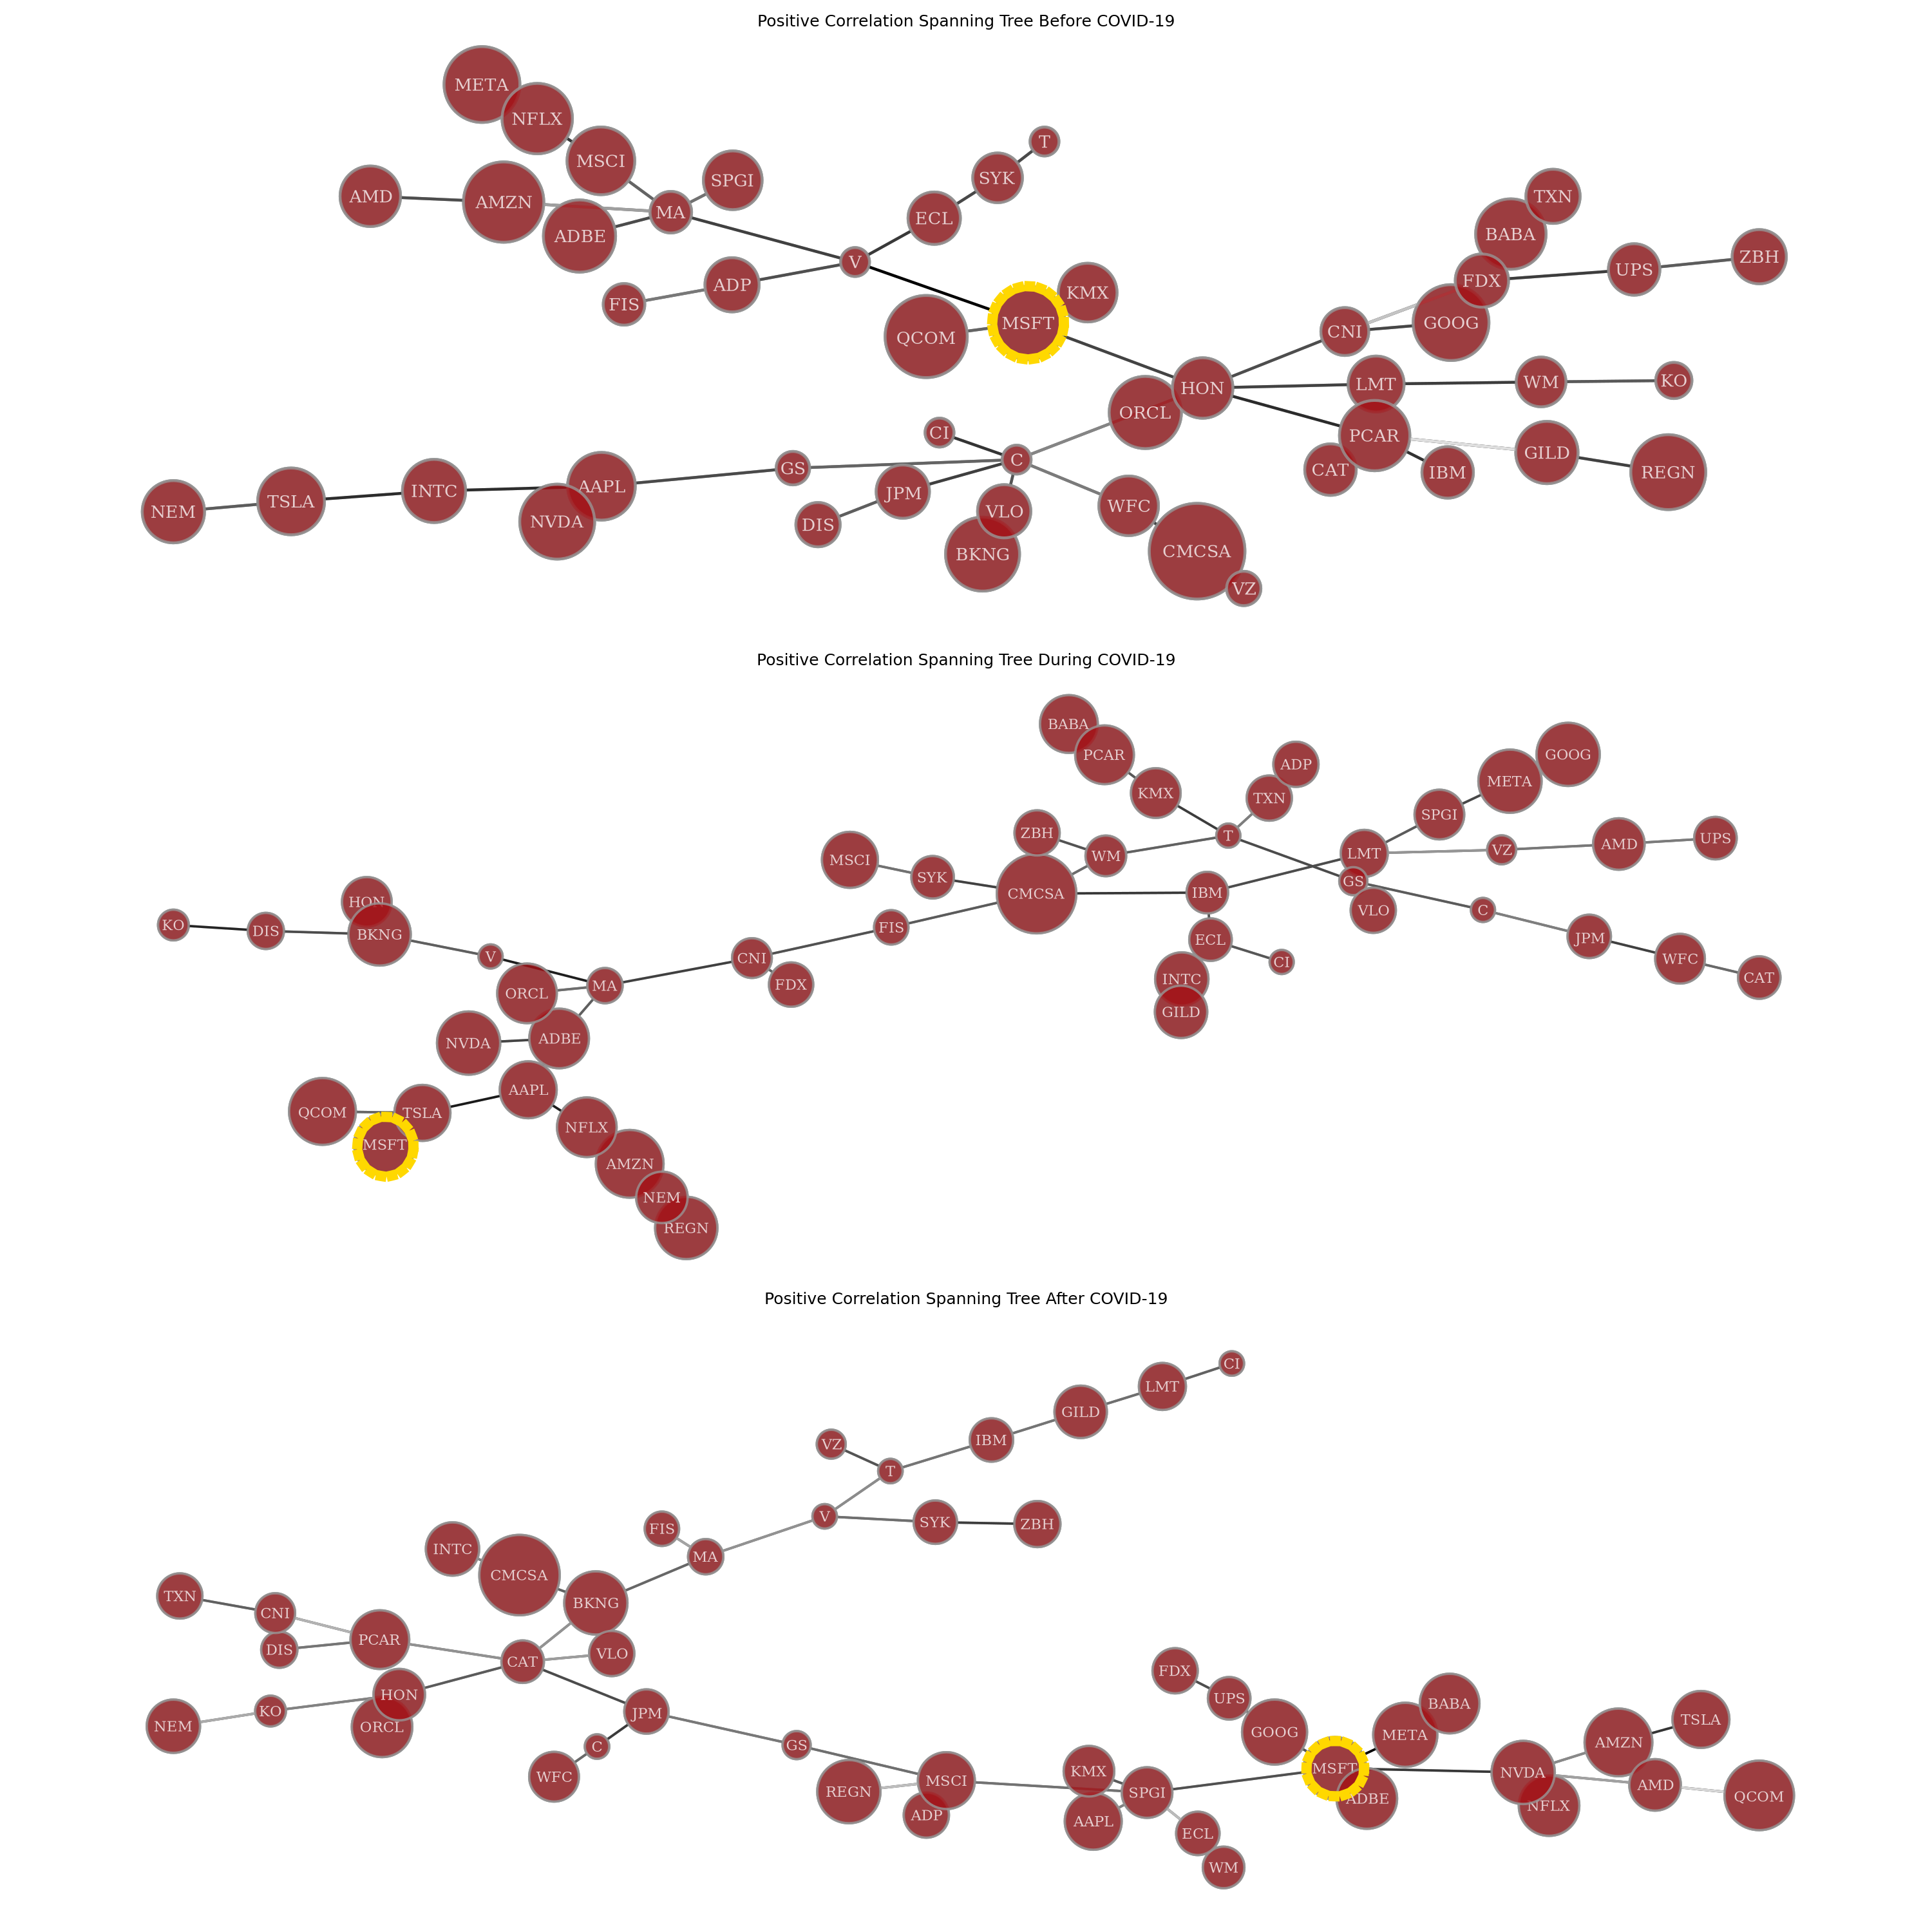
The shift aligns with price data: MSFT’s correlations barely move (≈10% change) while vulnerable sectors swing by ~45%, placing them at the centre of the crisis-era MST.5 The resilience of MSFT and its clique reinforces the “safe stock” interpretation, echoing the company’s pandemic-era financial disclosures.6

Recommendations for DBBA Capital
- Lean into the clique when conviction is high. MSFT is deeply intertwined with resilient tech and finance stocks.7 When you have a directional view on MSFT, extending positions to META, AMZN, GOOGL, JPM, and UNH keeps the portfolio aligned with shared-investor flows.
- Hedge by diversifying across clusters. If outlook is uncertain, use the MSFT ego analysis and the clustering view above to pick uncorrelated groups. This mirrors the approach advocated by Tola et al. for risk management via cluster-aware portfolios.8
MSFT’s persistence at the core of both investor holdings and return correlations makes it an attractive anchor position, provided the surrounding clique is monitored for structural breaks similar to those seen in 2020.
Footnotes
-
Vincent D. Blondel, Jean-Loup Guillaume, Renaud Lambiotte, and Etienne Lefebvre, “Fast Unfolding of Communities in Large Networks,” Journal of Statistical Mechanics: Theory and Experiment 2008(10), P10008 (2008). https://doi.org/10.1088/1742-5468/2008/10/P10008 ↩
-
Jennifer Golbeck, Introduction to Social Media Investigation: A Hands-on Approach, Syngress Publishing (2015). ↩
-
Mieszko Mazur, Man Dang, and Miguel Vega, “COVID-19 and the March 2020 Stock Market Crash. Evidence from S&P1500,” Finance Research Letters 38, 101690 (2021). https://doi.org/10.1016/j.frl.2020.101690 ↩
-
Junlong Zhang and Yu Luo, “Degree Centrality, Betweenness Centrality, and Closeness Centrality in Social Network,” in Proceedings of the 2nd International Conference on Modelling, Simulation and Applied Mathematics (MSAM 2017), Atlantis Press (2017); Britta Ruhnau, “Eigenvector-centrality—a Node-centrality?” Social Networks 22(4), 357–365 (2000). ↩
-
Yahoo Finance, “Stock Data for Canadian National Railway (CNI), Comcast Corporation (CMCSA), and Waste Management, Inc. (WM),” accessed 31 Oct 2024. https://finance.yahoo.com ↩
-
Microsoft News, “Microsoft Cloud Strength Drives Fourth Quarter Results,” press release, 30 Jul 2024. https://news.microsoft.com/2024/07/30/microsoft-cloud-strength-drives-fourth-quarter-results-6/ ↩
-
NASDAQ OMX Group, “NASDAQ Composite Index,” retrieved from FRED, Federal Reserve Bank of St. Louis (2024). https://fred.stlouisfed.org/series/NASDAQCOM ↩
-
Vincenzo Tola, Fabrizio Lillo, Mauro Gallegati, and Rosario N. Mantegna, “Cluster Analysis for Portfolio Optimization,” Journal of Economic Dynamics and Control 32(1), 235–258 (2008). https://doi.org/10.1016/j.jedc.2007.01.034 ↩